Swell Matrix’s detailed wave data might look like a bunch of random noise at first, but using its tools and filters will show you loads of info about the waves and sets. Get it dialed and you’ll be in sync with the ocean before you even show up at the beach.
Surfers expect sets to come at certain intervals, but sets have a lot of variation and set intervals and size can’t really be boiled down that easily.
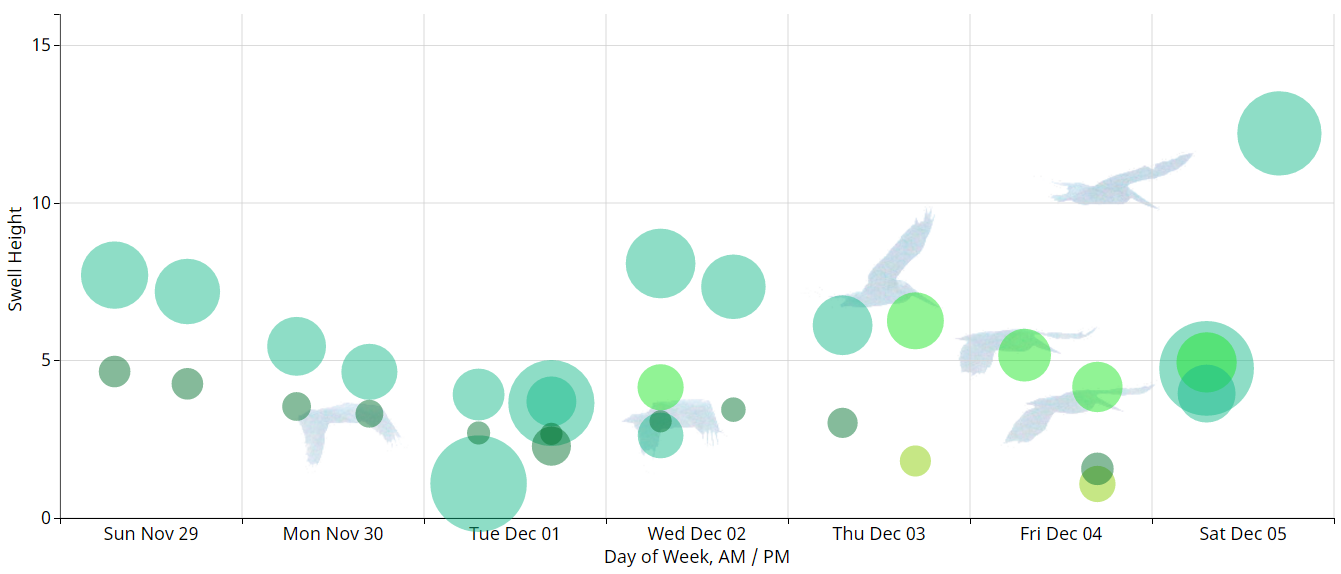
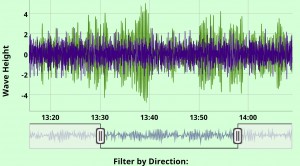
The vertical time series data is useful for getting a broad overview of the size of the largest waves. Use the slider to zoom all the way out and look at the scale on the left. The high and low spikes tell the height of the waves: 2 foot peaks and troughs equal 4 foot waves.
You can use the slider bar and filters at the bottom of the detailed wave summary to estimate how often a good set will come in. Sets, especially long periods, are easier to see if you use the North/South or East/West filters instead of vertical, which is the default. If you still don’t see any pulses and wave heights are continuous every minute or so, the waves are probably bumpy storm surf.
It’s usually easy to guess what the period of the sets are based on the bar chart and direction, but you can see also see what the wave periods are on the time series chart. Zoom way in and hover your mouse over the detailed wave graph and look at the time in the top right corner. Subtract the time from peak to peak or trough to trough to figure the period of the wave.
The wave direction (use the image below the detailed wave data), the buoy’s distance to the surf spot, and the spot’s bottom contours all influence a spot’s surf quality relative to the buoy’s waves.
Keeping an eye on the buoy before and after every surf will show you which buoy conditions equal good waves at the spots you surf.